Thought for the Day
MASTER OF BUSINESS ADMINISTRATION Laboratories
"Empowering minds, shaping futures — Priyadarshini College is where learning meets purpose."Business Communication Lab
The Business Communication Lab is designed to enhance students’ practical communication skills required in professional and business environments. The lab focuses on developing proficiency in verbal, non-verbal, and written communication through interactive and activity-based learning.
Students are trained in various aspects of business communication, including interpersonal communication, team interaction, and effective participation in meetings and presentations. The lab emphasizes the development of business writing skills such as drafting letters, emails, memos, reports, and proposals with clarity, accuracy, and proper formatting.
The lab also provides hands-on training in presentation skills, enabling students to plan, organize, and deliver effective individual and team presentations using modern digital tools. Special focus is given to employability skills, including resume preparation, cover letter writing, and interview techniques through mock sessions.
In addition, the lab familiarizes students with contemporary communication practices such as professional etiquette, telephone skills, cross-cultural communication, and communication in digital and e-business environments.
Overall, the Business Communication Lab aims to bridge the gap between academic learning and industry requirements by equipping students with essential communication competencies for career success.
Course Objectives:
1.To explain the various modes of communication and their application in business.
2.To impart knowledge on business writing skills and improving the readability of written communication.
3.To outline the importance of writing business reports and proposals
4.To explain the necessary employable skills.
5. To orient on the contemporary aspects of business communication.
Course Outcomes :
Students will be able to
1. Interpret the various modes of communication and its application in business
2.Categorize the various business writing skills and improve the readability of written communication.
3. Justify the importance of writing business reports and proposals.
4.Examine the necessary skills to enhance employability.
5.. Exemplify the need for up skilling on the contemporary aspects of business communication.
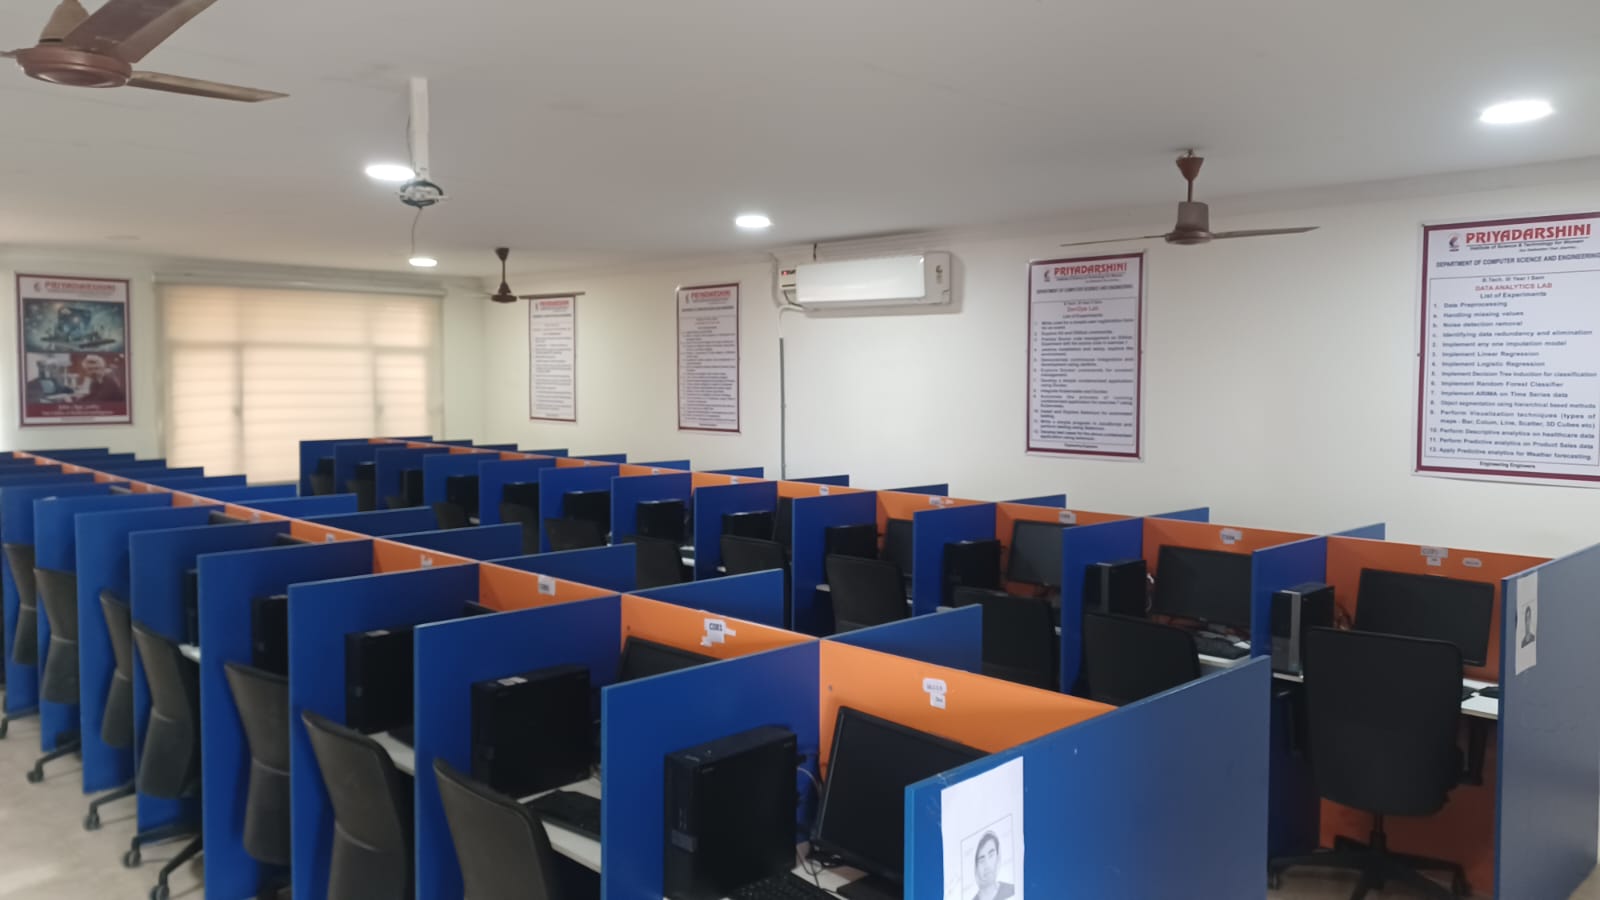
Data Analysis Lab (MS Excel & SPSS)
The Data Analysis Lab is designed to provide students with practical knowledge and hands-on experience in data handling, analysis, and interpretation using statistical software tools such as MS Excel and SPSS. The lab aims to develop analytical and problem-solving skills essential for data-driven decision-making in academic, research, and industry domains.
Students are introduced to the fundamental features and functions of MS Excel/SPSS, including data entry, formatting, and management techniques. The lab emphasizes organizing and manipulating data using templates, sorting, filtering, and validation tools to ensure accuracy and efficiency.
The course provides extensive practice in data visualization through charts, graphs, tables, worksheets, pivot tables, and pivot charts, enabling students to derive meaningful insights from raw data. Advanced functionalities such as formulas and statistical functions are also explored for effective data analysis.
Further, the lab focuses on applying statistical methods such as measures of central tendency, dispersion, correlation, and regression analysis. Students also gain exposure to various statistical tests including t-test, F-test, ANOVA, and Chi-square test for hypothesis testing and decision-making.
Additionally, the lab introduces time series analysis techniques such as moving averages and least squares method for forecasting and trend analysis.
Overall, the Data Analysis Lab equips students with essential technical and analytical skills required to interpret data, generate insights, and support informed decision-making in real-world scenarios.
Course Objectives
-
To impart knowledge on the functions of MS Excel and SPSS for data analysis.
-
To understand various templates and formatting techniques to organize and manipulate data in Excel/SPSS.
-
To understand data analysis using charts, graphs, tables, worksheets, pivot tables, and pivot charts.
-
To demonstrate data analysis using statistical tools such as correlation, regression, and other techniques.
-
To impart knowledge on various statistical tests for data-driven decision-making.
Course Outcomes
Students will be able to:
-
Identify the functions of MS Excel and SPSS for data analysis.
-
Examine data management and formatting practices using templates and tools in Excel/SPSS.
-
Analyze data using charts, graphs, tables, worksheets, pivot tables, and pivot charts to derive meaningful insights.
-
Justify the use of appropriate statistical tools and techniques for data analysis.
-
Evaluate the application of various statistical tests for effective decision-making.
Data Visualization Lab
The Data Visualization Lab is designed to provide students with practical exposure to the principles and techniques of transforming raw data into meaningful visual insights. The lab focuses on developing skills in data preprocessing, exploratory data analysis, and effective visual communication using modern tools such as Power BI, Tableau, Excel, and Python.
Students learn to create a variety of visual representations including charts, graphs, dashboards, and interactive reports for both structured and unstructured datasets. Emphasis is placed on selecting appropriate visualization techniques, applying design principles, and ensuring clarity and accuracy in data representation.
The lab also covers advanced topics such as dashboard development, storytelling with data, and visualization of text and network data. Students are trained to identify and avoid misleading visualizations and to follow ethical standards in data communication.
Overall, the lab equips students with the ability to analyze data, generate insights, and present findings effectively to support data-driven decision-making in business and real-world applications.
Course Objectives
-
To understand the principles and best practices of data visualization and visual encoding.
-
To apply data preprocessing and exploratory data analysis techniques to structured and unstructured datasets.
-
To use visualization tools such as Power BI, Tableau, Excel, and Python for creating meaningful visual representations.
-
To develop dashboards and visual stories for data-driven decision-making in business contexts.
-
To evaluate visualizations for accuracy, clarity, and ethical communication aligned with transparency and reporting standards.
ourse Outcomes
Students will be able to:
-
Demonstrate basic proficiency in data import, cleaning, and visualization tools.
-
Generate appropriate charts and plots for univariate, bivariate, and multivariate data.
-
Construct interactive dashboards and visual reports for business decision-making.
-
Apply ethical visualization practices by avoiding misleading representations of data.
-
Interpret and communicate data insights through storytelling using business or SDG datasets.
Financial Analytics Lab
The Financial Analytics Lab is designed to provide students with practical exposure to financial data analysis using spreadsheet tools. The lab focuses on applying analytical techniques to interpret financial statements, evaluate investment decisions, and assess financial risks and returns.
Students gain hands-on experience in analyzing financial statements through ratio analysis, trend analysis, and cash flow statements. The lab emphasizes the application of time value of money concepts, including present value, future value, annuities, and loan amortization using spreadsheet models.
The course also enables students to perform capital budgeting analysis using techniques such as Net Present Value (NPV), Internal Rate of Return (IRR), Payback Period, and Profitability Index. In addition, students explore financial risk and return measures, portfolio analysis, and equity valuation using models like CAPM.
Further, the lab introduces bond valuation concepts including duration, bond pricing, and immunization strategies. Students develop analytical skills to evaluate financial instruments and support data-driven financial decision-making.
Course Objectives
-
To enable understanding of various aspects of financial analytics.
-
To help understand the concepts of time value of money, risk, and return.
-
To impart knowledge of various capital budgeting techniques.
-
To elucidate various aspects of equity valuation.
-
To enlighten students on bond valuation concepts.
Course Outcomes
Students will be able to:
-
Understand and apply techniques of financial statement analysis.
-
Analyze the relevance of time value of money in financial decisions.
-
Apply various capital budgeting techniques for investment evaluation.
-
Evaluate industry, economic, and technical aspects in equity analysis.
-
Analyze bond valuation, duration, and immunization strategies.
HR Analytics Lab
The HR Analytics Lab is designed to provide students with practical exposure to the application of data analytics in human resource management. The lab focuses on transforming traditional HR practices into data-driven decision-making processes using analytical tools and techniques.
Students gain hands-on experience in collecting, organizing, and analyzing HR data related to key functional areas such as recruitment, training, performance appraisal, employee engagement, compensation, and talent management. The lab emphasizes the use of MS Excel for data analysis, including pivot tables, dashboards, and visualization techniques.
The course introduces students to different levels of HR analytics—descriptive, diagnostic, predictive, and prescriptive—enabling them to interpret HR metrics and identify trends and patterns. Students also learn to apply basic statistical techniques such as correlation, regression, and hypothesis testing for effective HR decision-making.
In addition, the lab provides exposure to modern tools and technologies such as Tableau, Power BI, and programming languages like R and Python for advanced analytics and visualization. The lab also focuses on predictive modeling and prescriptive techniques such as decision trees and what-if analysis.
Course Objectives
-
To explain the evolution of HRM to HR Analytics and its role in achieving business outcomes.
-
To introduce HR analytics models, data types, and data preparation methods.
-
To demonstrate the use of MS Excel for analyzing key HR functions.
-
To provide an overview of tools for descriptive and diagnostic HR analytics.
-
To introduce predictive and prescriptive techniques and tools in HR analytics.
Course Outcomes
Students will be able to:
-
Describe the importance, scope, and levels of HR analytics.
-
Apply data examination techniques and compare HR analytics models.
-
Use MS Excel to analyze HR metrics across various HR processes.
-
Create dashboards, perform pivot analysis, and apply basic diagnostic techniques.
-
Apply predictive models and design basic prescriptive solutions for HR decision-making.